Training & softwareTraining & qualityDashboard is internalReal case study
C95: From loose emails to automatic quality insights for driving courses and Code 95 training
C95 provides driving courses and Code 95 training at multiple locations. After each course they collect participant feedback. The existing process was a simple form whose results arrived by email. Every submission had to be opened, scored and summarised by hand. Comparing locations, courses and instructors therefore took a lot of time, and important signals were hard to spot quickly.
Client / domainC95Driving training and Code 95 courses
SetupCustom WordPress pluginSurvey and internal dashboard
ReachMultiple locationsIncluding Meppel and Staphorst
StatusSurvey is publicDashboard is internal, figures are fictional
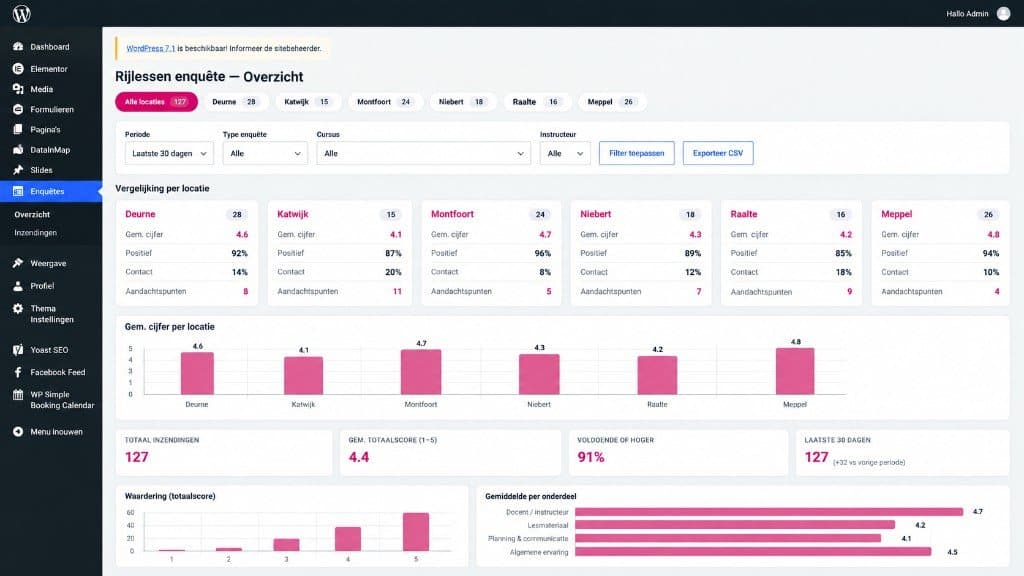
Central dashboard in WordPress. Figures are fictional.
Figures, locations and counts in the dashboard are fictional. Real participant data is not shown, to protect trainee privacy.
The trajectory
The challenge vs. the solution
What went wrong first, and what now lives in the software or on the site.
Before
The challenge
C95 needed more than a digital form. Feedback had to support quality improvement in a structured way, without processing every evaluation by hand.
- Results arrived by email and had to be opened one by one.
- Scoring, summarising and comparing locations, courses and instructors took too much time.
- Low scores and attention points were hard to spot quickly.
- Management information stayed stale because the work stopped in the inbox.
Result
The solution
We built a complete evaluation system and a matching custom WordPress plugin. Participants fill in a survey after their course. As soon as they submit it, automatic processing starts.
- All answers are stored in a structured way and turned into measurable scores.
- Averages per topic are calculated automatically.
- Low ratings are checked and marked as attention points.
- Each submission gets a clear summary, and the central dashboard updates at once.
Build-up
Key deliverables
Automatic processing, audits and summaries
Central dashboard with filters and location comparison
Export for reporting without retyping from email
TransparencyPublicly verifiable
What you can check yourself
The survey participants fill in is public at code95-cursussen.nl/enquete. The dashboard is internal WordPress software. The screenshots show that survey and the dashboard. Figures in the dashboard are fictional, so real participant data stays private. I do not claim “X% faster” or real submission counts. This case describes the chain: survey in, structured storage, automatic scoring, dashboard and export.
Sound familiar?
Who will recognise this
Training providers and multi-location service businesses that receive feedback by email and then summarise it in Excel or Word. Same pattern as a timber yard pulling orders from mail: the bottleneck is not “we have no form”, it is the processing. See custom software and AI: an integration or automation from €2,000, a web application from €5,000, fixed price after intake.
Integration or automation from €2,000
Web application from €5,000
Always a fixed price after intake. Source code belongs to the client.
Ask for a guide priceMore about this case
More about this case
Context
C95 provides driving courses and Code 95 refresher training, including offer in Meppel and Staphorst, across multiple locations. Watching quality here means knowing, after each course, how instructor, content, applicability, materials, organisation and location were rated. That does not work while every submission stays a loose email. The survey is live at code95-cursussen.nl/enquete.
Every submission is processed automatically
The plugin stores answers in structure, converts them into scores, calculates averages per topic, checks for low ratings, marks attention points, writes a summary and updates the central dashboard. The team no longer copies forms out of email or runs the calculations and comparisons by hand.
One dashboard for all quality information
In the WordPress dashboard C95 sees how courses are rated. Results can be filtered by period, survey type, course, location and instructor. The view includes submission count, average overall score, scores per quality topic, location comparisons, change versus earlier periods, automatically flagged attention points, individual evaluations and audits, plus export for further reporting. The screenshot above uses fictional figures. We do not publish real participant data.
The outcome
The old process stopped at an email. The new system turns every submission into management information. C95 now has a centralised evaluation process, current insight into course quality, automatic audits and summaries, faster spotting of improvement points, better comparisons between locations and courses, and less recurring admin work. The system is built to grow with extra locations or courses.
From feedback to action
Collecting information is only the first step that was digitised. Processing, scoring and reporting now run automatically as well. Less manual work, faster insight, more time for actual quality improvement. That is the difference between a form and a process.
Want something like this?
The approach in this case study is a standard service. See what it includes and what it costs.
Next step
Want to automate a manual process too?
Discuss what a comparable project would look like for your situation - scope, approach and expected results.
No-obligation consultationReply within one working dayMeeting in Wanneperveen or online